blog
Estimating Emotet’s size and reach
In this Blog
Jump to
As many of you will be aware, Emotet, one of the most dangerous botnets in operation, restarted its malicious activity on 16th September 2019. Since its resurgence, Spamhaus Malware Labs has been closely monitoring and studying Emotet’s activity. Here’s what we’ve uncovered...
Change in Emotet’s behavior
One of the most noticeable changes that we observed over the past three months was that Emotet had predominantly spammed Microsoft Office documents containing malicious macros. This differed significantly from its old modus operandi of mixing both infected Office documents and URLs in its malware campaigns.
We found this rather odd, as most anti-spam solutions these days tend to block or quarantine, by default, all Office documents that include macros with suspicious functions like CreateProcess, ShellExecute, etc. We initially deduced from this change in behavior that the cyber-criminals using Emotet considered this to be the most cost-effective solution. However, over the past few days (approximately 6th December 2019), we are once again observing the inclusion of malware URLs. Perhaps those anti-spam solutions were proving too efficient at blocking the macro-enabled MS Office documents?
Emotet email volume and corresponding attachments
The period of our detailed observation commenced on 9th October 2019 and ended on 7th December 2019. It focuses on the spamming part of Emotet; therefore, our deductions relating to size only apply to this part of the botnet. We suspect the overall size to be much greater, as it would include dormant infected machines i.e., those machines which aren’t spamming.
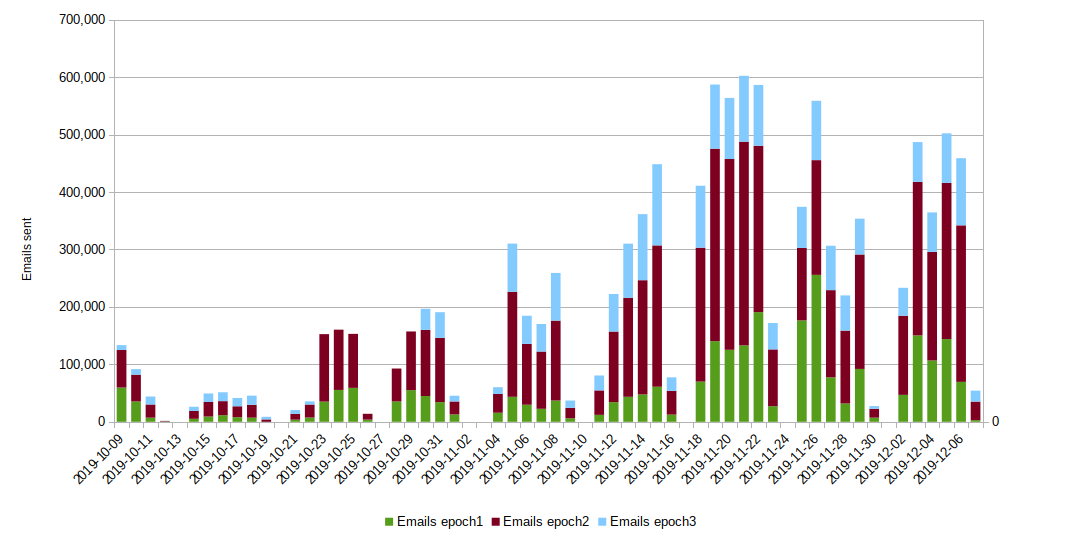
The following graph shows the number of emails detected per day (divided per Emotet epoch).

The above data infers that Emotet started slowly during its first few weeks back, before ramping up to its highest volumes in the week commencing Mon 18th November 2019. However, the variance in the number of unique file attachments did not change relative to the volumes. It is worth noting that over the final few weeks of this reporting period, Emotet started working on Saturdays too, albeit at very low volumes.
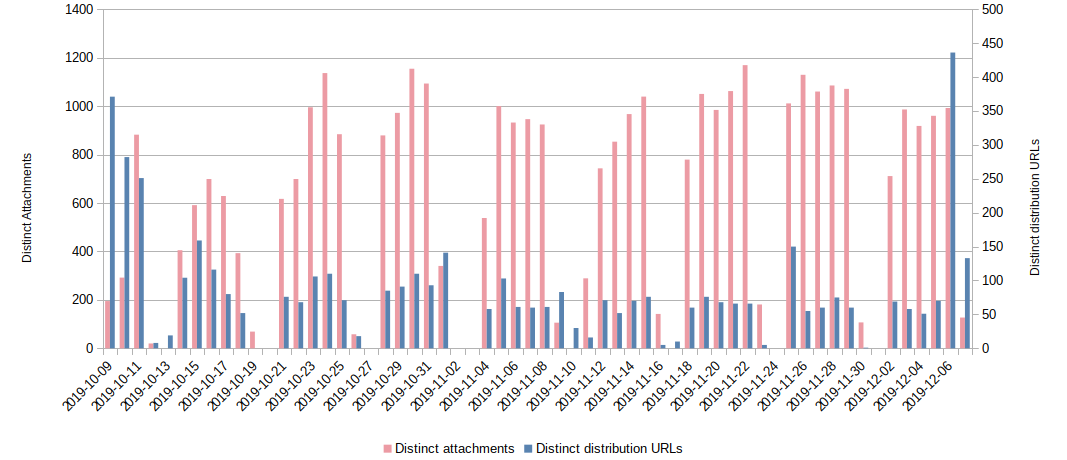
This next graph shows how many distribution URLs, compared to distinct attachments, we have observed. Please note that when we refer to “distinct attachment,” we mean only that the file checksum was different, not that the distribution URL was also different, as files with different checksums would often use the same distribution URL.

Take a look at the spike in distribution URLs on 6th December 2019; this corresponds with Emotet restarting spamming malware URLs directly through emails, as referred to earlier.
Emotet recipient frequency
Now, let’s analyze how efficient Emotet is in targeting unsuspecting victims. We already know that Emotet exfiltrates Outlook/Thunderbird address-books from infected machines, and also uses thread hijacking to try and lure targets into opening the attachment.
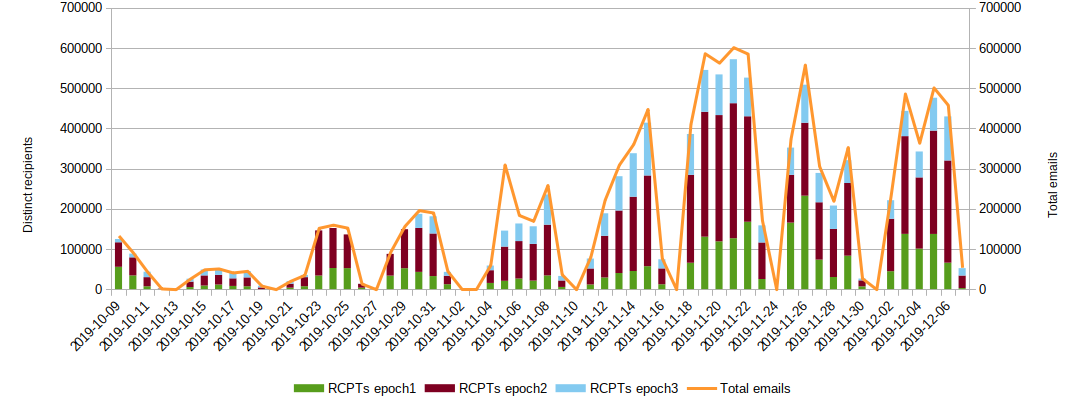
This graph shows how many separate recipients were detected, scaled to the total of email sent.

In our humble opinion, this is pretty impressive! Emotet sends one single email to each different recipient every day, with minimal overlap. This means that any individual recipient would most likely receive only one of Emotet’s emails per day; from a criminal’s perspective, this is positive, as being too ‘noisy’ can be dangerous.
A notable exception to the above was on 5th November 2019. On this date, we suspect that something probably went awry with Emotet, because two different infected emails were sent to almost every recipient.
Number of spamming IP addresses
Below the graph illustrates the daily distribution of unique spamming IP addresses we detected per Emotet epoch:

The largest peak we observed over this period was more than 18,000 unique malspamming IP addresses, which gives the operators a good IP and geo diversity.
From our observations, we suspect that epoch2 is the most populated part of the botnet, closely followed by epoch1, while epoch3 is still lagging in terms of reach.
More stats on Emotet
Last but not least, here are some global statistics on all the autonomous systems, countries and sent emails that we have detected over the observation period:
| Total number of ASn detected: | 5.430 |
| Total number of unique IPs detected: | 120.764 |
| Total Countries participating: | 193 |
| Total emails sent: | 10.935.346 |
| Total distribution URLs: | 4.726 |
| Distinct RCPTs targeted: | 8.052.961 |
| Top 30 Networks | ||
|---|---|---|
| Position | ASn | No. of IPs |
| 1 | 8151 | 9180 |
| 2 | 4788 | 3878 |
| 3 | 3352 | 3485 |
| 4 | 5384 | 2487 |
| 5 | 45595 | 2363 |
| 6 | 3269 | 2127 |
| 7 | 4134 | 2108 |
| 8 | 45899 | 1998 |
| 9 | 24560 | 1765 |
| 10 | 18881 | 1759 |
| 11 | 3462 | 1667 |
| 12 | 7303 | 1545 |
| 13 | 37457 | 1400 |
| 14 | 12430 | 1285 |
| 15 | 9121 | 1279 |
| 16 | 7713 | 1241 |
| 17 | 22927 | 1227 |
| 18 | 5713 | 1195 |
| 19 | 17552 | 1186 |
| 20 | 6147 | 1125 |
| 21 | 28006 | 1104 |
| 22 | 6400 | 1079 |
| 23 | 12479 | 1051 |
| 24 | 23969 | 1003 |
| 25 | 14754 | 1000 |
| 26 | 3816 | 902 |
| 27 | 30722 | 869 |
| 28 | 45758 | 858 |
| 29 | 28573 | 831 |
| 30 | 9329 | 767 |
| Top 30 Countries | ||
|---|---|---|
| Position | Country | No. of IPs |
| 1 | MX | 11966 |
| 2 | BR | 7691 |
| 3 | ES | 7108 |
| 4 | IN | 6550 |
| 5 | ZA | 6154 |
| 6 | IT | 6042 |
| 7 | AR | 5172 |
| 8 | MY | 5167 |
| 9 | PK | 3864 |
| 10 | VN | 3634 |
| 11 | US | 3525 |
| 12 | TH | 3501 |
| 13 | CN | 3313 |
| 14 | CO | 2856 |
| 15 | AE | 2841 |
| 16 | TR | 2721 |
| 17 | ID | 2211 |
| 18 | EC | 2157 |
| 19 | TW | 1832 |
| 20 | PE | 1702 |
| 21 | CL | 1618 |
| 22 | PH | 1412 |
| 23 | DE | 1307 |
| 24 | SA | 1286 |
| 25 | DO | 1189 |
| 26 | SG | 1016 |
| 27 | LK | 960 |
| 28 | KR | 875 |
| 29 | AU | 855 |
| 30 | VE | 831 |
For SOCs, CERTs, and CSIRTs: Abuse.ch has some good tips for mitigation.
Spamhaus Malware Labs will continue to monitor Emotet closely to see how this threat continues to evolve; it’s come far from the days when it was a simple banking trojan. In the meantime, ensure you’re protecting yourself.
Please note: botnets are dynamic by nature, therefore other measurement may differ.


